
Learn how Funnel and Stages Distribution calculate opportunity data, how Funnel conversion and revenue work, how to control stage visibility, and how to add either widget to a dashboard.
Funnel is designed for sequential progression. Stages Distribution is designed for current placement. The same opportunity can therefore be represented differently in each widget.
2. Key Benefits
3. Prerequisites and Limitations
4. Funnel vs. Stages Distribution
5. How the Funnel Widget Works
6. How the Stages Distribution Widget Works
7. How To Configure Pipeline Visibility
8. How To Add Funnel or Stages Distribution to a Dashboard
9. Frequently Asked Questions
10. Need Help?
What Are Funnel and Stages Distribution Widgets?
Funnel and Stages Distribution are General dashboard widgets that visualize opportunity data from pipelines.
The Funnel widget shows sequential progression through visible pipeline stages so you can evaluate conversion and drop-off.
The Stages Distribution widget shows where open opportunities currently sit, with Won and Lost opportunities displayed separately.
Key Benefits
Using the appropriate widget gives you a clearer view of either opportunity progression or current pipeline health.
- Track Pipeline Progression: Use Funnel to understand how opportunities advance through sequential stages.
- Identify Conversion Drop-Offs: Compare Funnel sections to see where fewer opportunities continue forward.
- Monitor Current Pipeline Distribution: Use Stages Distribution to see where open opportunities currently sit.
- Separate Outcomes from Active Stages: Review Won and Lost opportunities separately in Stages Distribution.
- Control Reporting Visibility: Choose which pipeline stages appear in Funnel and Stages Distribution reporting.
- Switch Between Pipelines: Use the pipeline dropdown in the widget to review different pipelines.
Prerequisites and Limitations
Correct pipeline structure, visibility settings, and dashboard access help ensure both widgets display the expected opportunity data.
- Create at least one pipeline with opportunity stages.
- Enable the applicable stages for Funnel or pie-chart reporting.
- Ensure the user has the required Dashboard Stats permission.
- Ensure the user can access the dashboard containing the widget.
- Arrange Funnel stages in the order opportunities are expected to progress.
Keep in mind: Won and Lost are opportunity statuses and do not need to be created as pipeline stages. Funnel calculations also use the opportunity's last status change date rather than its Created date when evaluating the selected reporting period.
Funnel vs. Stages Distribution
The main difference is whether you want to measure progression through a process or see current placement inside the pipeline.
| Widget | Best For | How Opportunities Are Shown |
|---|---|---|
| Funnel | Sequential conversion analysis | Later-stage opportunities also contribute to earlier Funnel sections because they progressed through the process. |
| Stages Distribution | Current pipeline monitoring | Open opportunities appear in the individual stage where they currently sit. Won and Lost are shown separately. |
Example: If an open opportunity currently sits in Proposal Sent, Stages Distribution shows it under Proposal Sent. Funnel can also count that opportunity toward earlier visible sections because it progressed through those stages.
How the Funnel Widget Works
Funnel uses cumulative logic so each section represents opportunities that reached that point or progressed beyond it.
Core Formula: Opportunities in a Funnel section = opportunities from the current visible stage through the final visible stage, including applicable Won opportunities.
As the Funnel moves forward:
- Opportunities still in earlier stages are removed from later Funnel sections.
- Opportunities that reached later stages contribute to applicable earlier sections.
- Won appears as the final successful outcome.
- Won opportunities contribute to preceding Funnel sections because they completed the process.
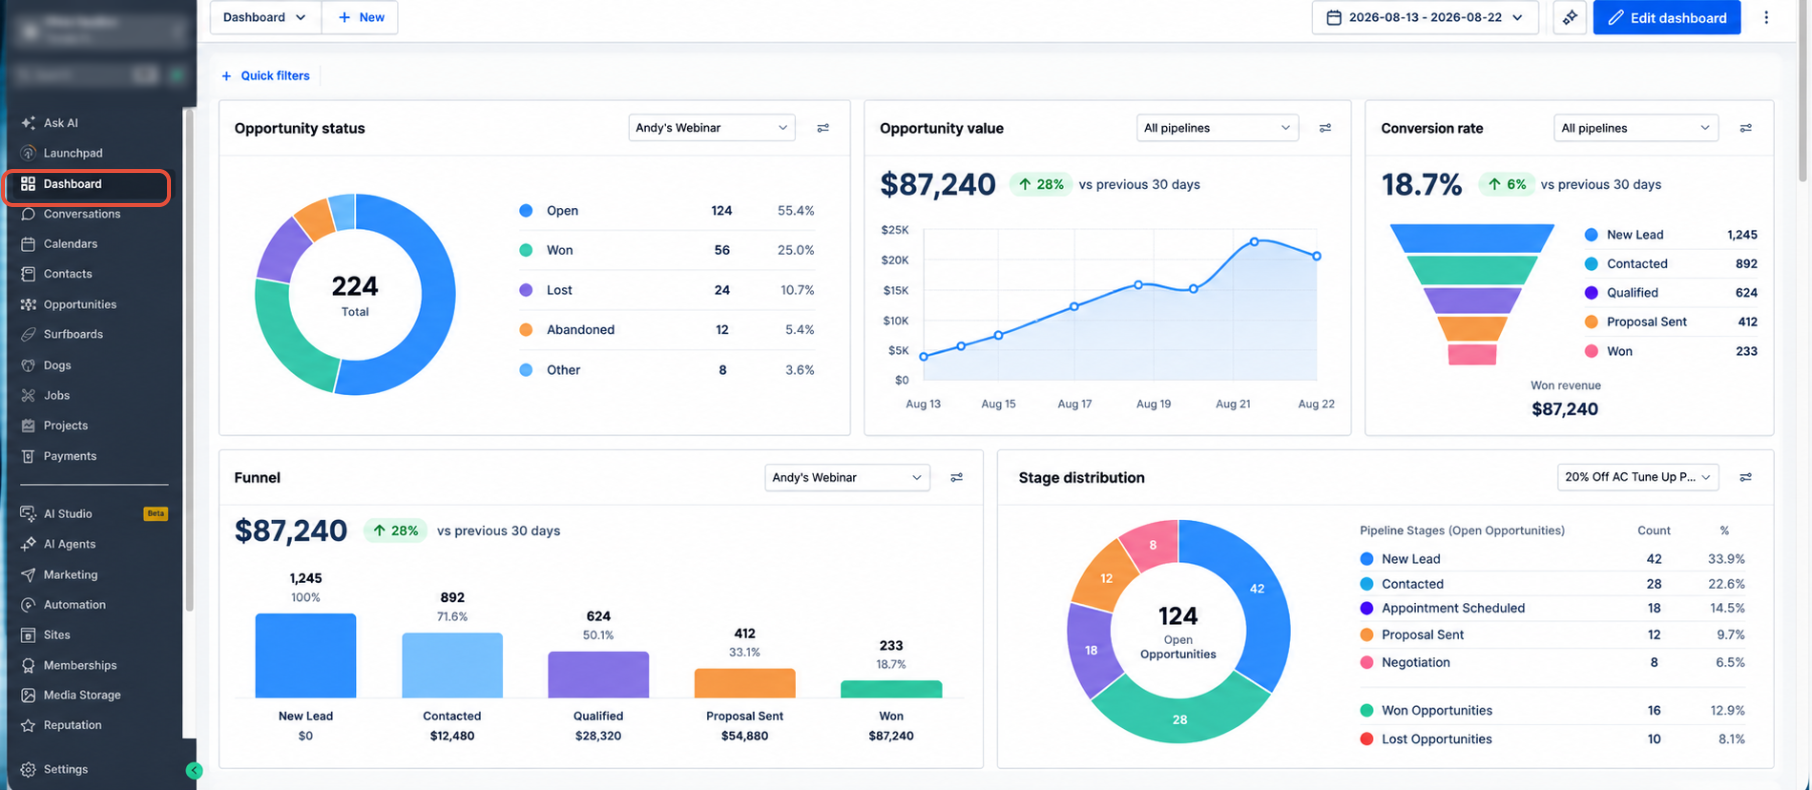
Funnel Conversion Rates
Funnel provides two conversion views so you can evaluate both overall progression and stage-to-stage performance.
- Cumulative Conversion: Shows progression relative to the beginning of the Funnel.
- Next-Step Conversion: Shows progression relative to the preceding Funnel section.
Funnel Revenue
Revenue follows the same sequential logic as opportunity counts. Opportunity value from later stages and Won opportunities contributes to the applicable earlier Funnel sections.
How the Stages Distribution Widget Works
Stages Distribution shows where open opportunities currently sit instead of using cumulative stage progression.
- Open opportunities are shown in their current visible pipeline stage.
- Won opportunities are displayed separately.
- Lost opportunities are displayed separately.
- The widget also provides conversion information for the displayed distribution.
How To Configure Pipeline Visibility
Pipeline visibility controls determine which stages are included in Funnel and Stages Distribution reporting.
- From the Sub-Account View, click Opportunities.
- Select Pipelines.
- Open the pipeline you want to configure.
- Locate the pipeline stages.
- Use the funnel icon to control Funnel reporting visibility.
- Use the pie-chart icon to control Stages Distribution reporting visibility.
- Save the pipeline changes.
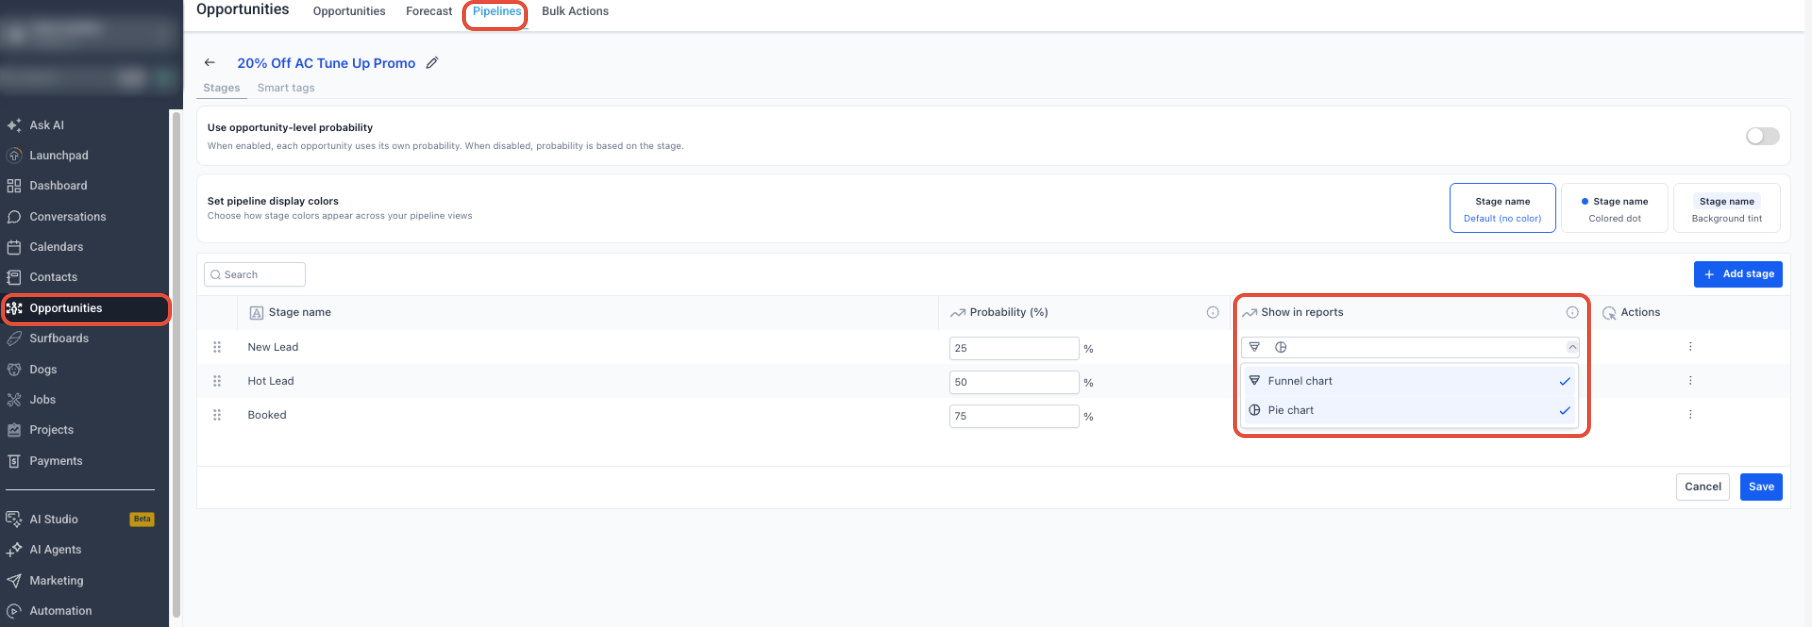
Note: Won and Lost are created automatically as opportunity statuses and do not need to be added as pipeline stages.
How To Add Funnel or Stages Distribution to a Dashboard
Adding both widgets to the same dashboard lets you compare sequential conversion with current pipeline placement without leaving the Dashboard area.
- From the Sub-Account View, open Dashboard.
- Open the dashboard you want to modify.
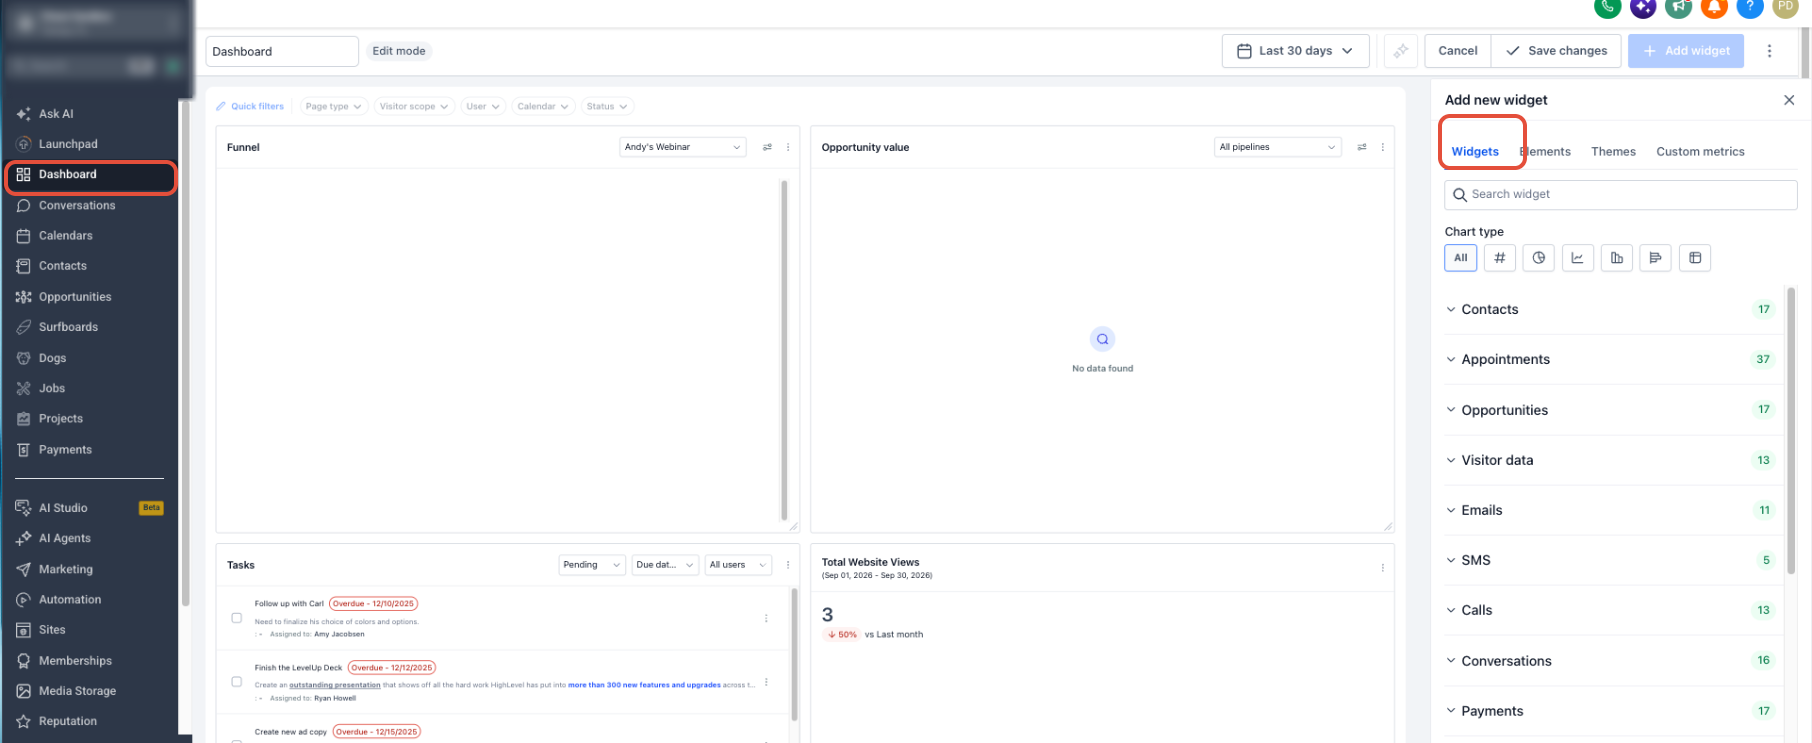
- Click Edit Dashboard.
- Click + Add Widget.
- Locate the General widget category.
- Select Funnel or Stages Distribution.
- Configure the available widget settings.
- Position or resize the widget as needed.
- Click Save Changes.
Frequently Asked Questions
Need Help?
- A stage is missing: Open the pipeline settings and confirm the appropriate Funnel or pie-chart visibility control is enabled.
- Funnel counts look higher than expected: Remember that later-stage opportunities also contribute to applicable earlier Funnel sections.
- Dashboard totals do not match another report: Compare the selected pipeline, reporting period, filters, date logic, and widget type.
- A user cannot see the dashboard data: Confirm the user has the required Dashboard Stats permission and dashboard access.
- You need exact current-stage counts: Use Stages Distribution rather than Funnel.