
Ad Manager provides a dashboard for tracking your LinkedIn ad performance alongside other supported advertising platforms. With LinkedIn Statistics, you can monitor results from overall campaign groups down to individual ads.
This guide explains where to find LinkedIn statistics, which metrics are available, and how to interpret results for Lead Generation and Website Traffic campaigns.
TABLE OF CONTENTS
- Where to find LinkedIn Statistics
- Statistics Hierarchy
- Metrics Overview
- Performance Analytics (Trends Over Time)
- Detailed Metrics Tables
- Metrics by Objective
- How to Interpret the Data
- Best Practices
- Frequently Asked Questions
Where to find LinkedIn Statistics
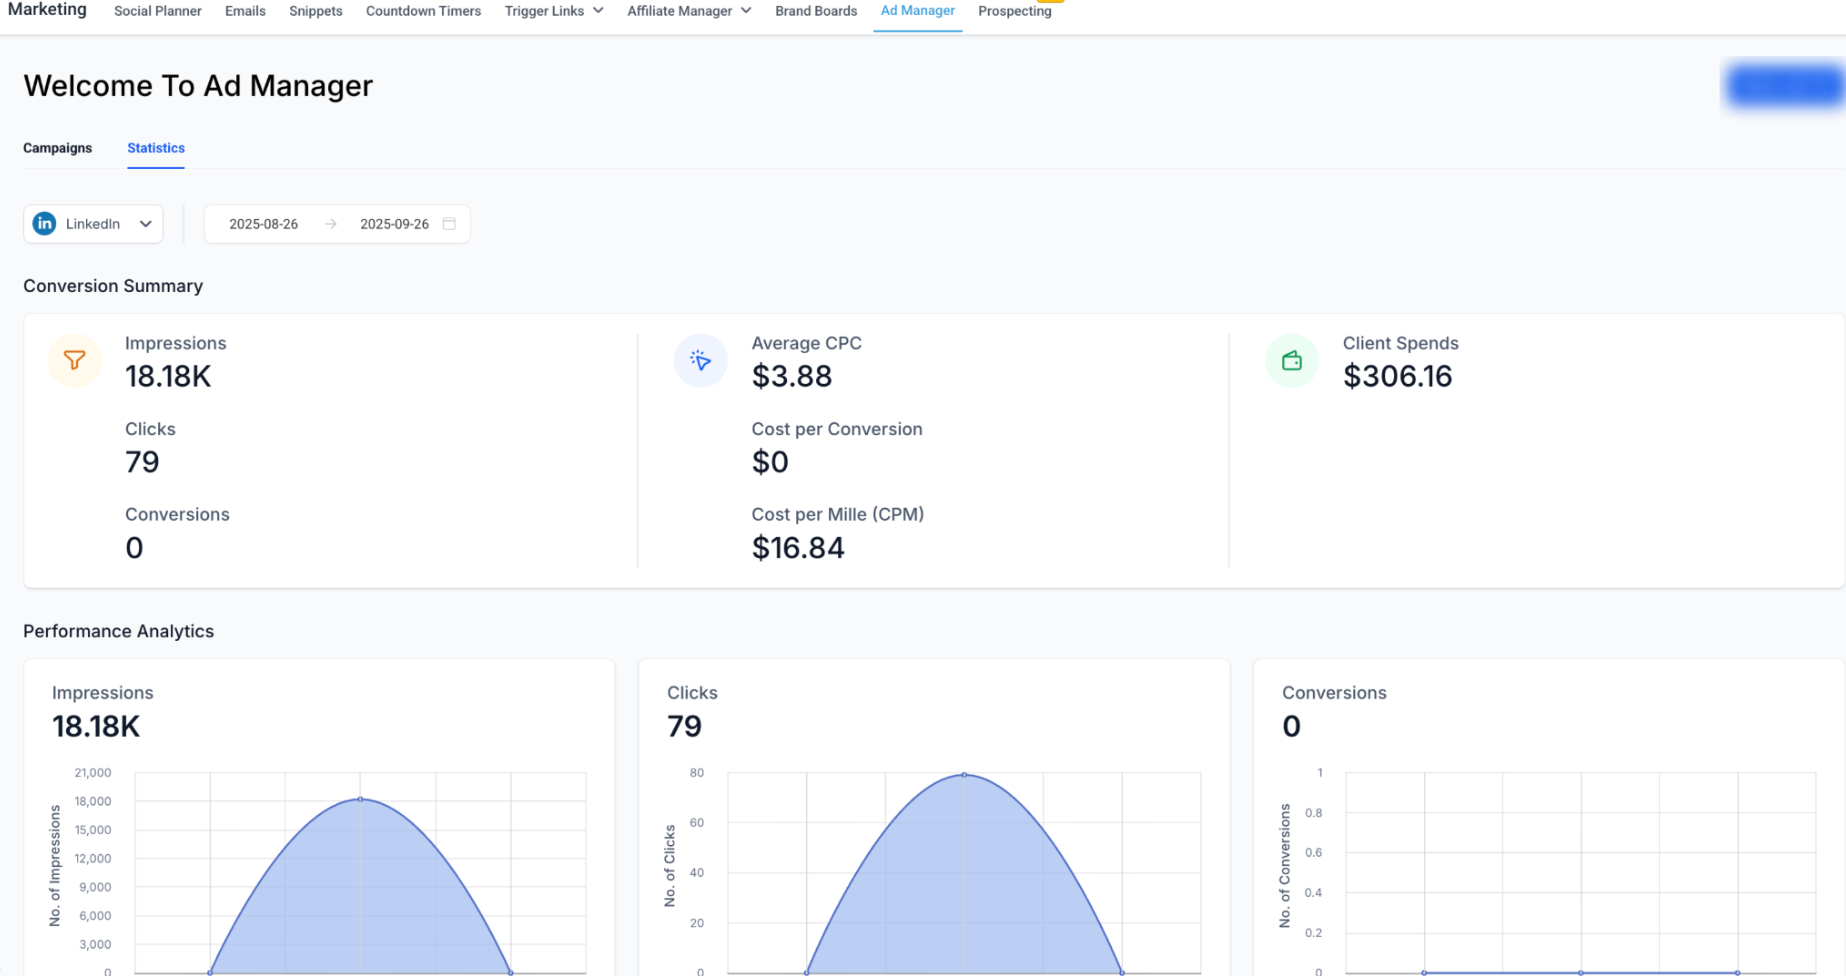
1. Navigate to Marketing > Ad Manager > Statistics.
2. From the platform dropdown, select LinkedIn.
3. Choose the date range you want to analyze.
Statistics Hierarchy
LinkedIn advertising data in Ad Manager uses the following hierarchy:
Campaign Group – The top-level container for related campaigns.
Campaign – Contains targeting, audience, and campaign-level settings.
Ad – The individual creative shown to the audience.
You can drill down through:
Campaign Group > Campaign > Ad
Note: LinkedIn has updated its Campaign Manager terminology. In LinkedIn Campaign Manager, a Campaign Group may appear as a Campaign, while a Campaign may correspond to an Ad Set. The underlying campaign structure remains comparable.
Metrics Overview
The Statistics dashboard can display performance metrics across your LinkedIn campaigns, including:
Impressions – Number of times your ad was displayed.
Clicks – Total chargeable clicks based on the campaign objective.
CTR (Click-through Rate) – Percentage of impressions that resulted in chargeable clicks.
Conversions – Desired actions attributed to an ad after a click or impression when conversion tracking is configured.
Leads – Number of leads collected through LinkedIn Lead Generation campaigns.
Lead Form Opens – Number of times users opened a LinkedIn Lead Gen Form, when available.
Lead Form Completion Rate – Percentage of opened Lead Gen Forms that were submitted, when available.
Performance Analytics (Trends Over Time)
Graphs help you identify performance trends over the selected date range:
Impressions graph – Shows how often your ads were displayed over time.
Clicks graph – Shows changes in chargeable ad clicks.
Conversions graph – Shows attributed conversion activity when conversion tracking is available.
Detailed Metrics Tables
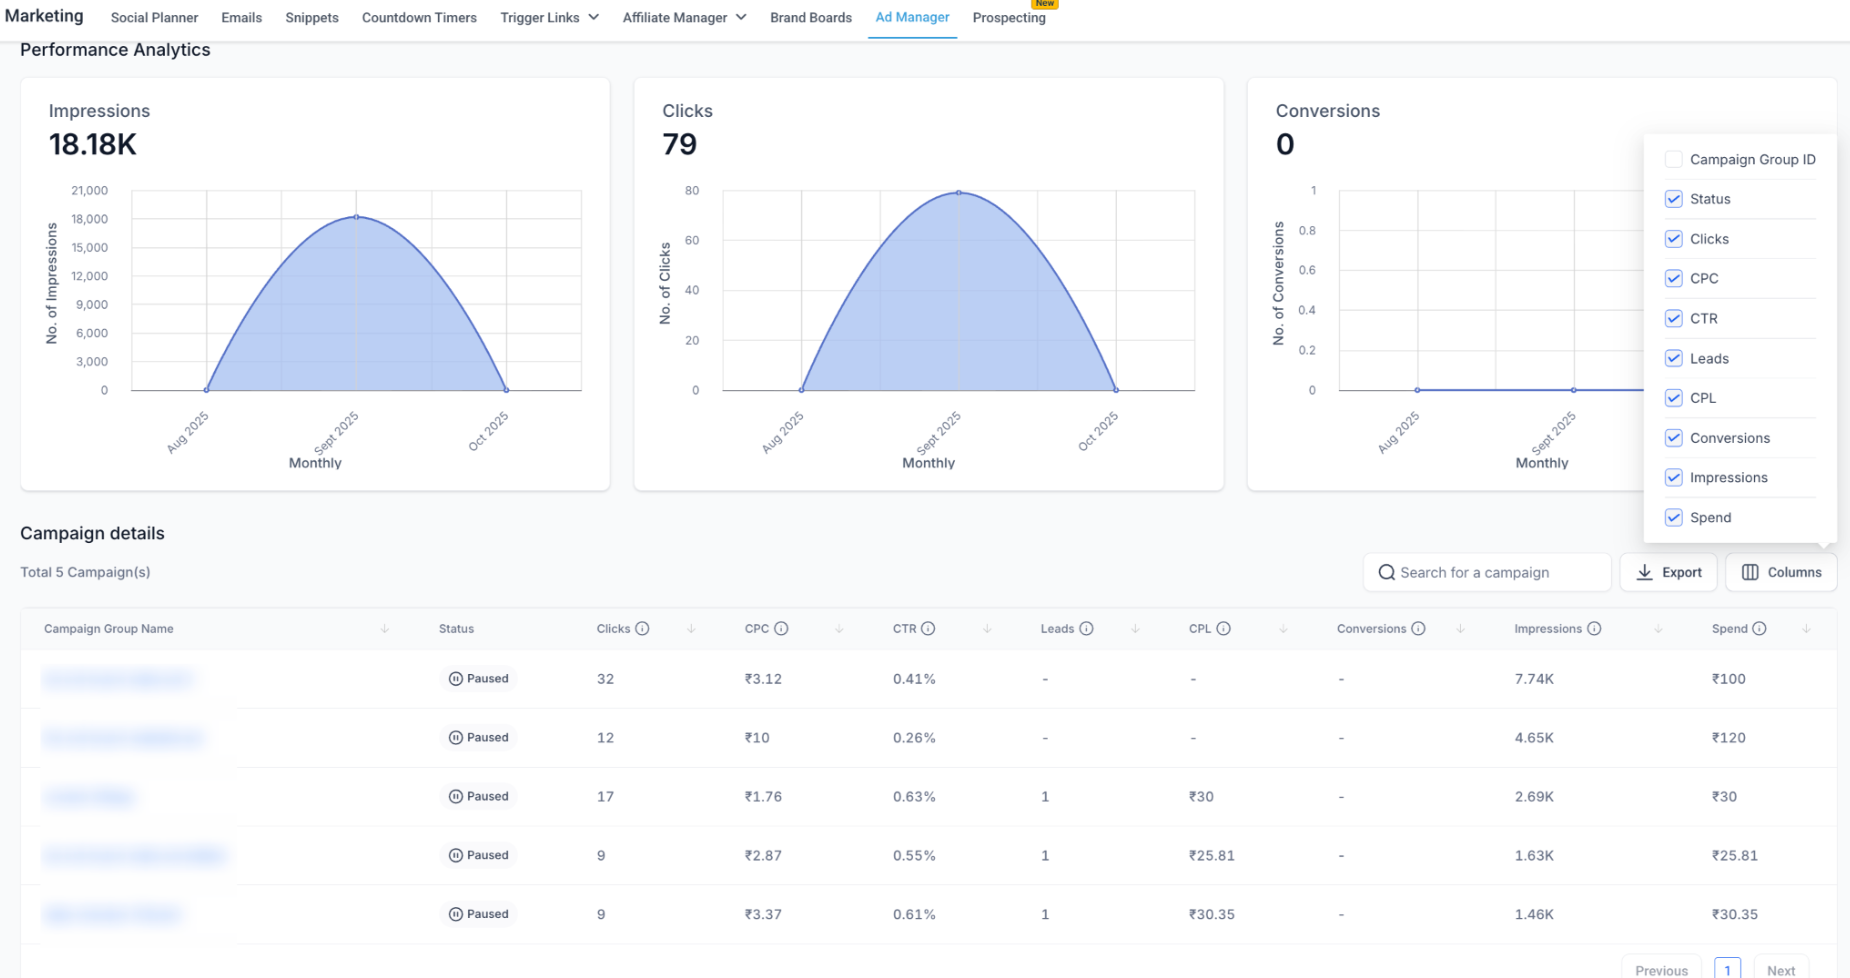
Each level of the hierarchy includes a detailed metrics table. Available columns can include:
Status – Shows whether the item is Active, Paused, or In Review.
Impressions – Number of times the ad was displayed.
Clicks – Number of chargeable ad clicks.
CTR (Click-through Rate) – Clicks divided by impressions, expressed as a percentage.
Leads – Number of completed lead submissions for Lead Generation campaigns.
Conversions – Attributed actions for campaigns with conversion tracking configured.
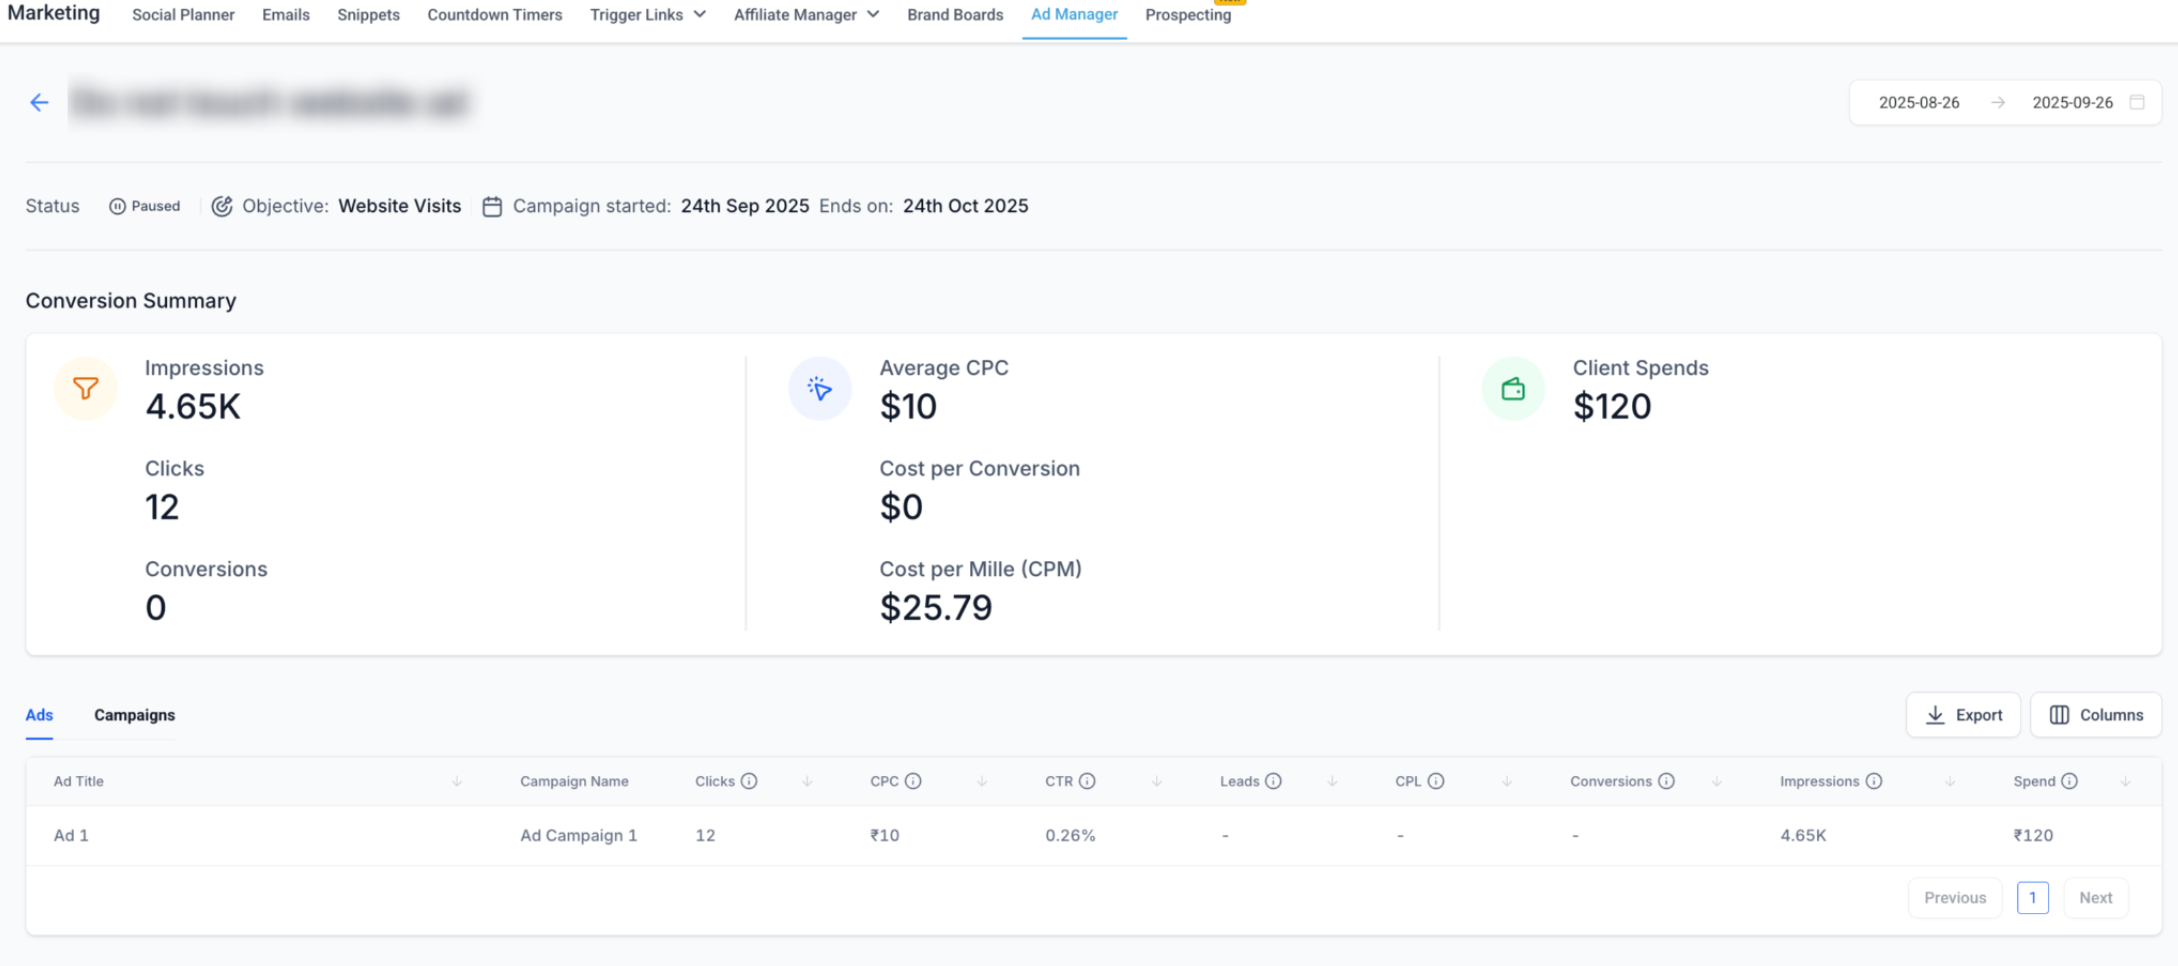
Available metrics can vary depending on the campaign objective and tracking configuration.
Metrics by Objective
1. Lead Generation Campaigns
Lead Generation campaigns focus on measuring LinkedIn Lead Gen Form performance.
Common metrics include:
Leads – Number of completed lead form submissions.
Lead Form Opens – Number of times users opened the Lead Gen Form, when available.
Lead Form Completion Rate – Percentage of opened forms that were submitted, when available.
Impressions – Number of times the ads were displayed.
Clicks – Number of chargeable ad clicks.
CTR – Percentage of impressions that resulted in chargeable clicks.
2. Website Traffic Campaigns
Website Traffic campaigns are designed to direct users to an external website or landing page.
Key performance indicators can include:
Clicks – Chargeable clicks generated by the campaign.
CTR – Percentage of impressions that resulted in a chargeable click.
Impressions – Number of times the ads were displayed.
Conversions – Attributed website actions when LinkedIn conversion tracking is configured.
Conversion-related metrics may not appear if conversion tracking is not configured or no attributable conversion activity occurred during the selected date range.
How to Interpret the Data
Use the available metrics together to understand campaign performance:
Impressions and Clicks – Compare ad visibility with the number of interactions.
CTR – Indicates how frequently impressions result in chargeable clicks.
Leads – Shows the volume of completed lead submissions from Lead Generation campaigns.
Lead Form Opens and Completion Rate – Help evaluate how us
- Conversions – Show attributed website actions when conversion tracking is configured.
Review metrics within the context of the campaign objective. Different campaign types may display different performance indicators.
Best Practices
- Check campaign status – Ads marked In Review do not begin delivering until LinkedIn approves them.
- Use drilldowns – Compare campaigns within the same campaign group or ads within the same campaign.
- Customize your view – Use the Columns button to add or remove available metrics based on what you want to analyze.
- Export reports – Select Export to generate a spreadsheet for additional reporting.
- Compare relevant metrics – Focus on metrics that align with the objective of each campaign.
- Review the selected date range – Make sure the reporting period includes the campaign activity you want to analyze.
Frequently Asked Questions
Q. Why are my LinkedIn statistics not showing any data?
Statistics may not appear if the campaign has not started delivering, the selected date range does not include campaign activity, or no reportable activity has occurred.
Verify the selected date range and campaign status before reviewing the statistics.
Q. What is the difference between impressions and clicks?
Impressions measure how many times your ad was displayed.
Clicks represent chargeable clicks based on the campaign objective.
A single user may generate multiple impressions.
Q. Why don't I see conversion metrics for my LinkedIn campaign?
Conversion metrics depend on conversion tracking being configured and the campaign generating attributable conversion activity.
If conversion tracking is not configured, or no conversions were attributed during the selected period, conversion data may not be available.
Q. Why does campaign terminology differ from LinkedIn Campaign Manager?
Ad Manager organizes LinkedIn advertising data using:
Campaign Group > Campaign > Ad
LinkedIn Campaign Manager may use updated terminology in which a Campaign Group appears as a Campaign and a Campaign appears as an Ad Set.
The underlying hierarchy remains comparable even though the labels differ.