
SLA Performance Reporting helps you monitor how consistently your team responds within defined service-level targets. The dashboard provides overall SLA results, user-level performance, channel-level performance, response-time trends, and filtering tools so you can identify delays and improve response efficiency.
TABLE OF CONTENTS
- What is SLA Performance Reporting?
- Where to Find SLA Reports
- Overview of SLA Reports
- SLA Metrics Explained
- Filters and Sort
- Note
With SLA Performance Reporting, you can monitor how efficiently your team responds to customer messages, track SLA adherence, and identify areas for improvement - all from a centralized dashboard.
Note: You can enable this feature from Labs - Conversations SLA Performance Dashboard. This feature is available only on the New Conversations interface. To enable the new interface, turn on CRM Redesign: Conversations and Contacts Page(Beta) from Labs. Data for SLA Performance Dashboard is available starting March 23, 2026.
What is SLA Performance Dashboard?
SLA Performance Dashboard provides insights into how well your team meets response time commitments (SLAs). It helps you answer key questions like:
- Are we meeting our SLAs consistently?
- Which channels need attention?
- How is each metric changing over time?
Where to Find SLA Dashboard
Open Conversations Module. Go to: Analytics → SLA Performance
You’ll find three reports on a single page:
- SLA Overview Report
- User Performance Report
- Channel-Level Report
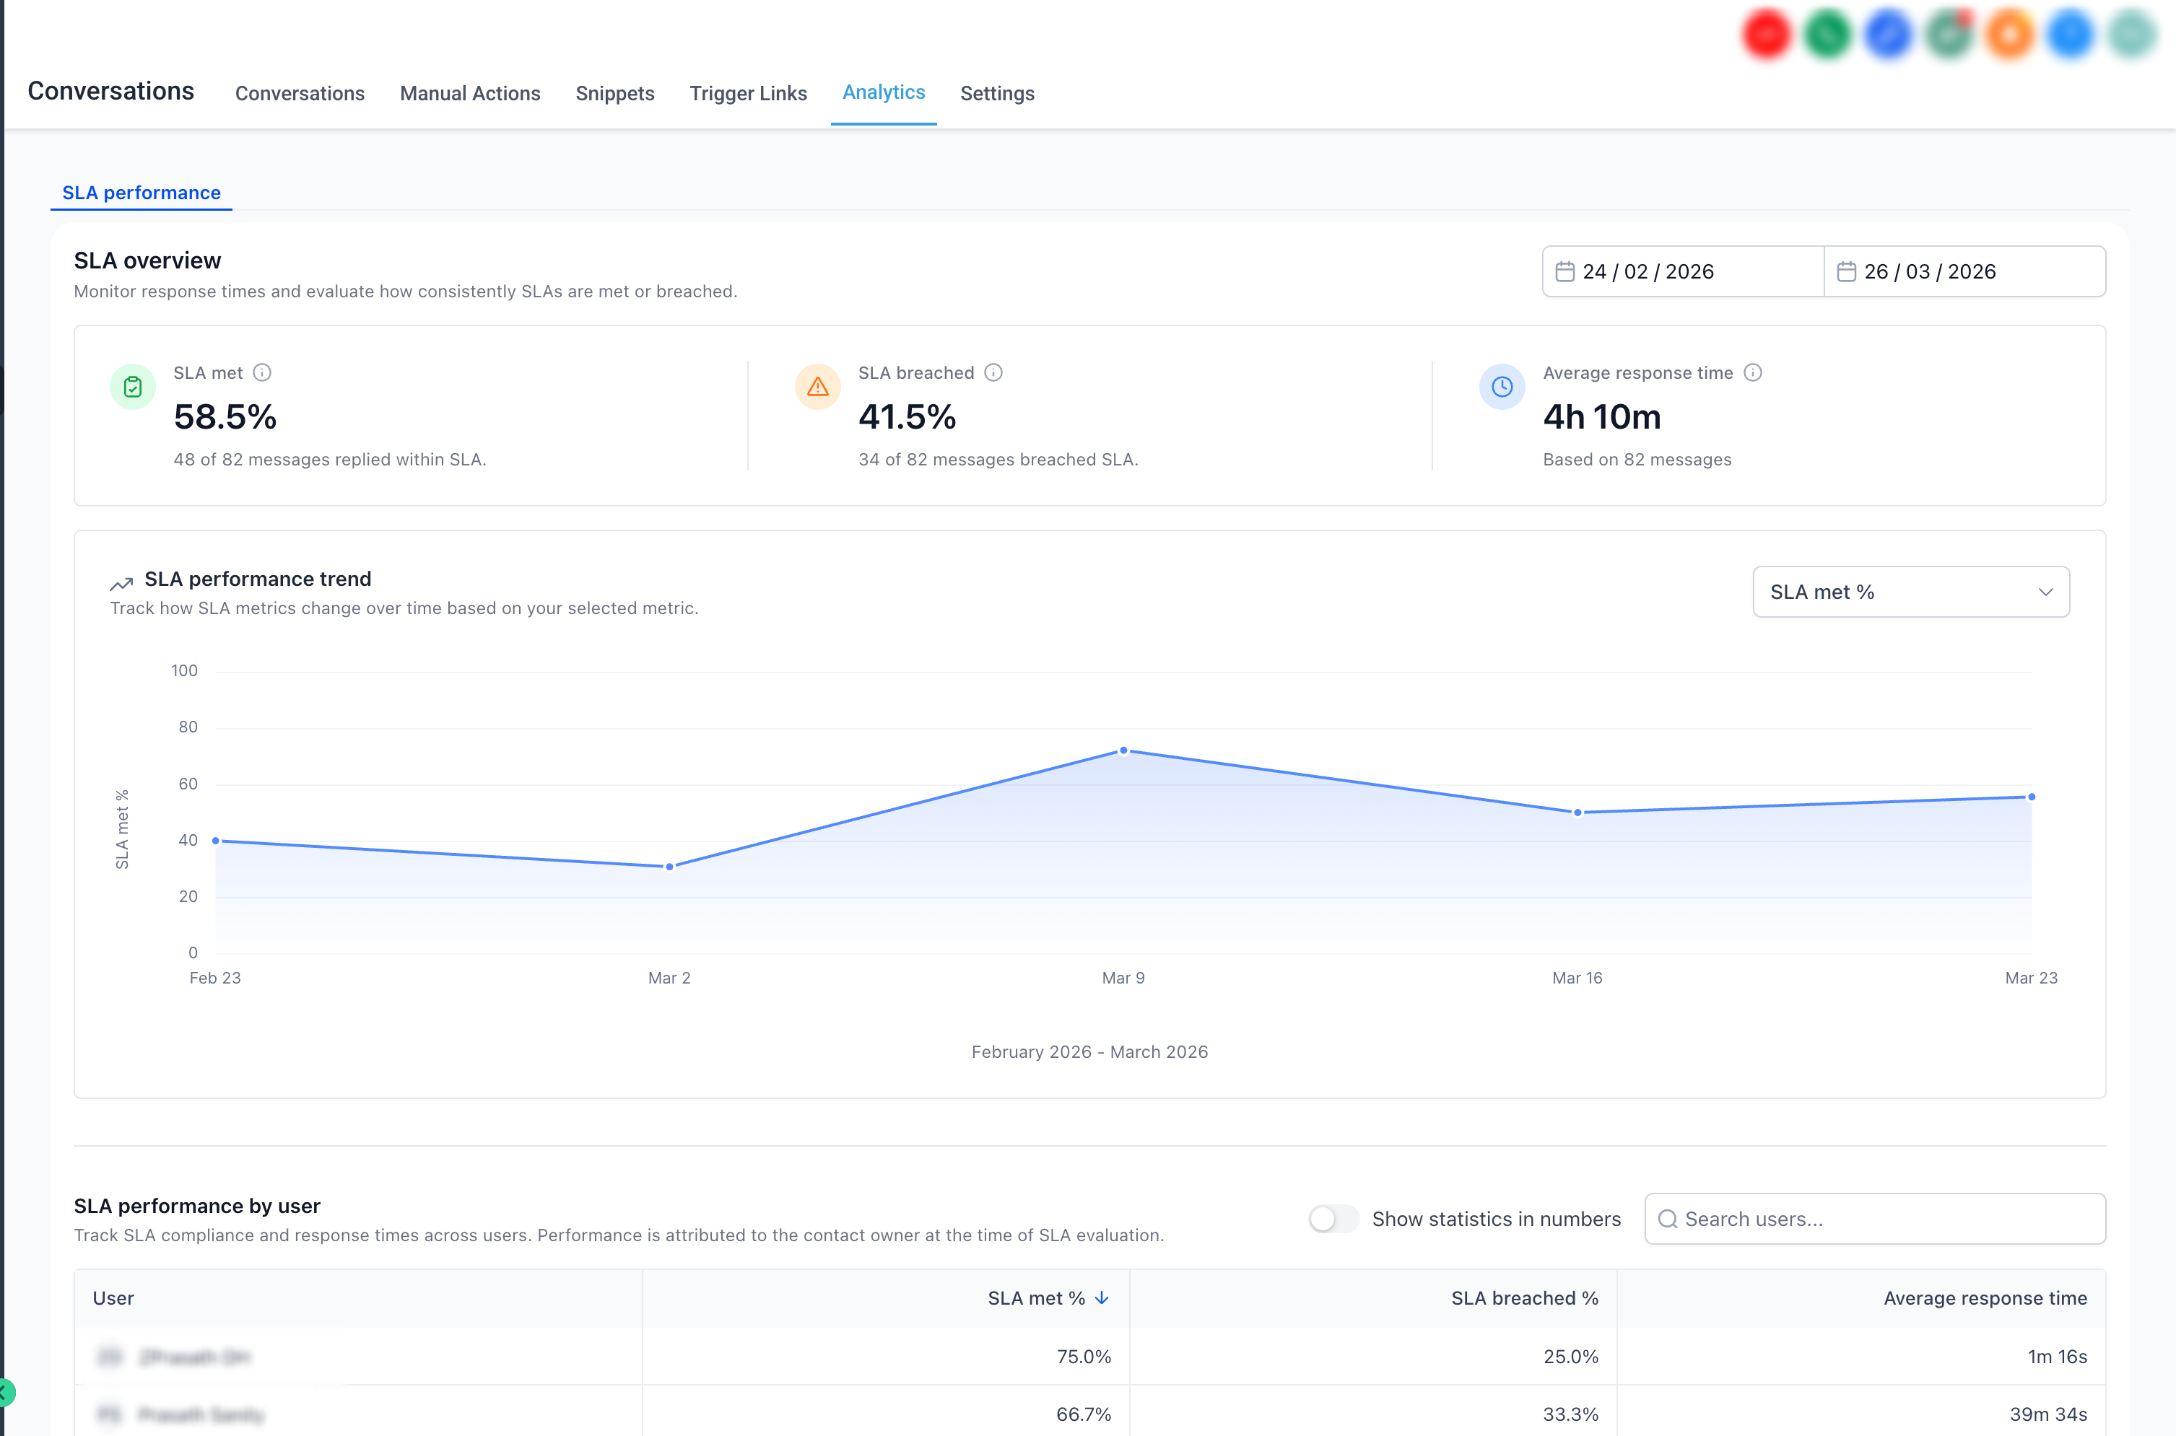
Overview of SLA Reports
1. SLA Overview:
Provides a summary of SLA performance, including:
- SLA Met % and Breached %
- Average response time
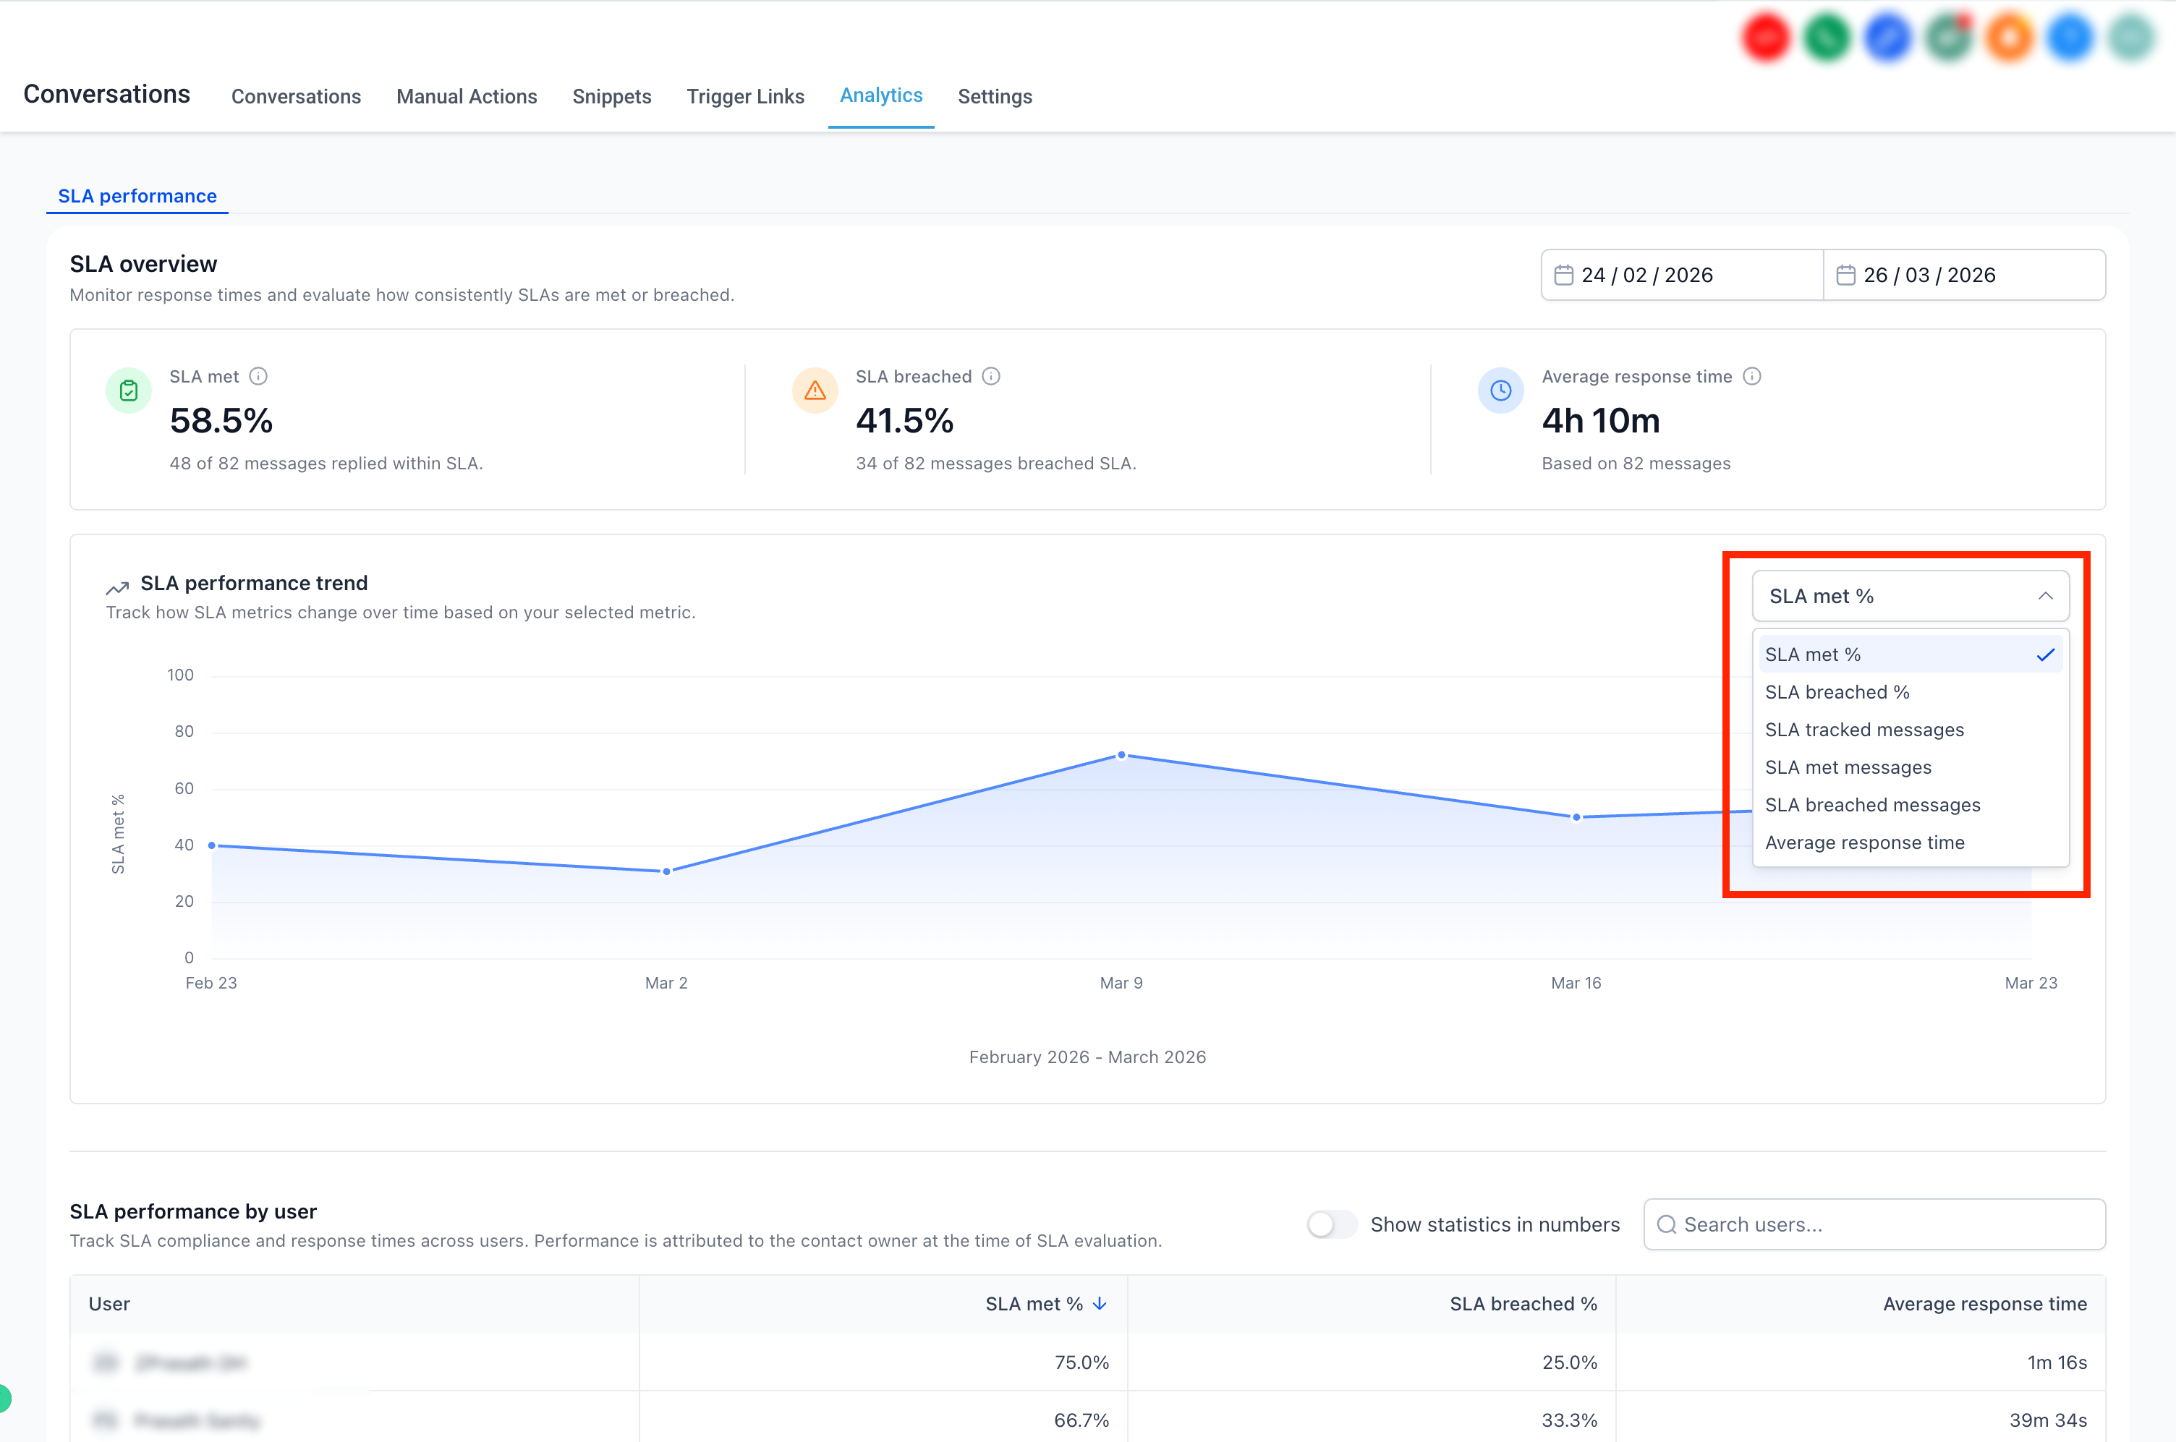
- Trend chart for performance over time
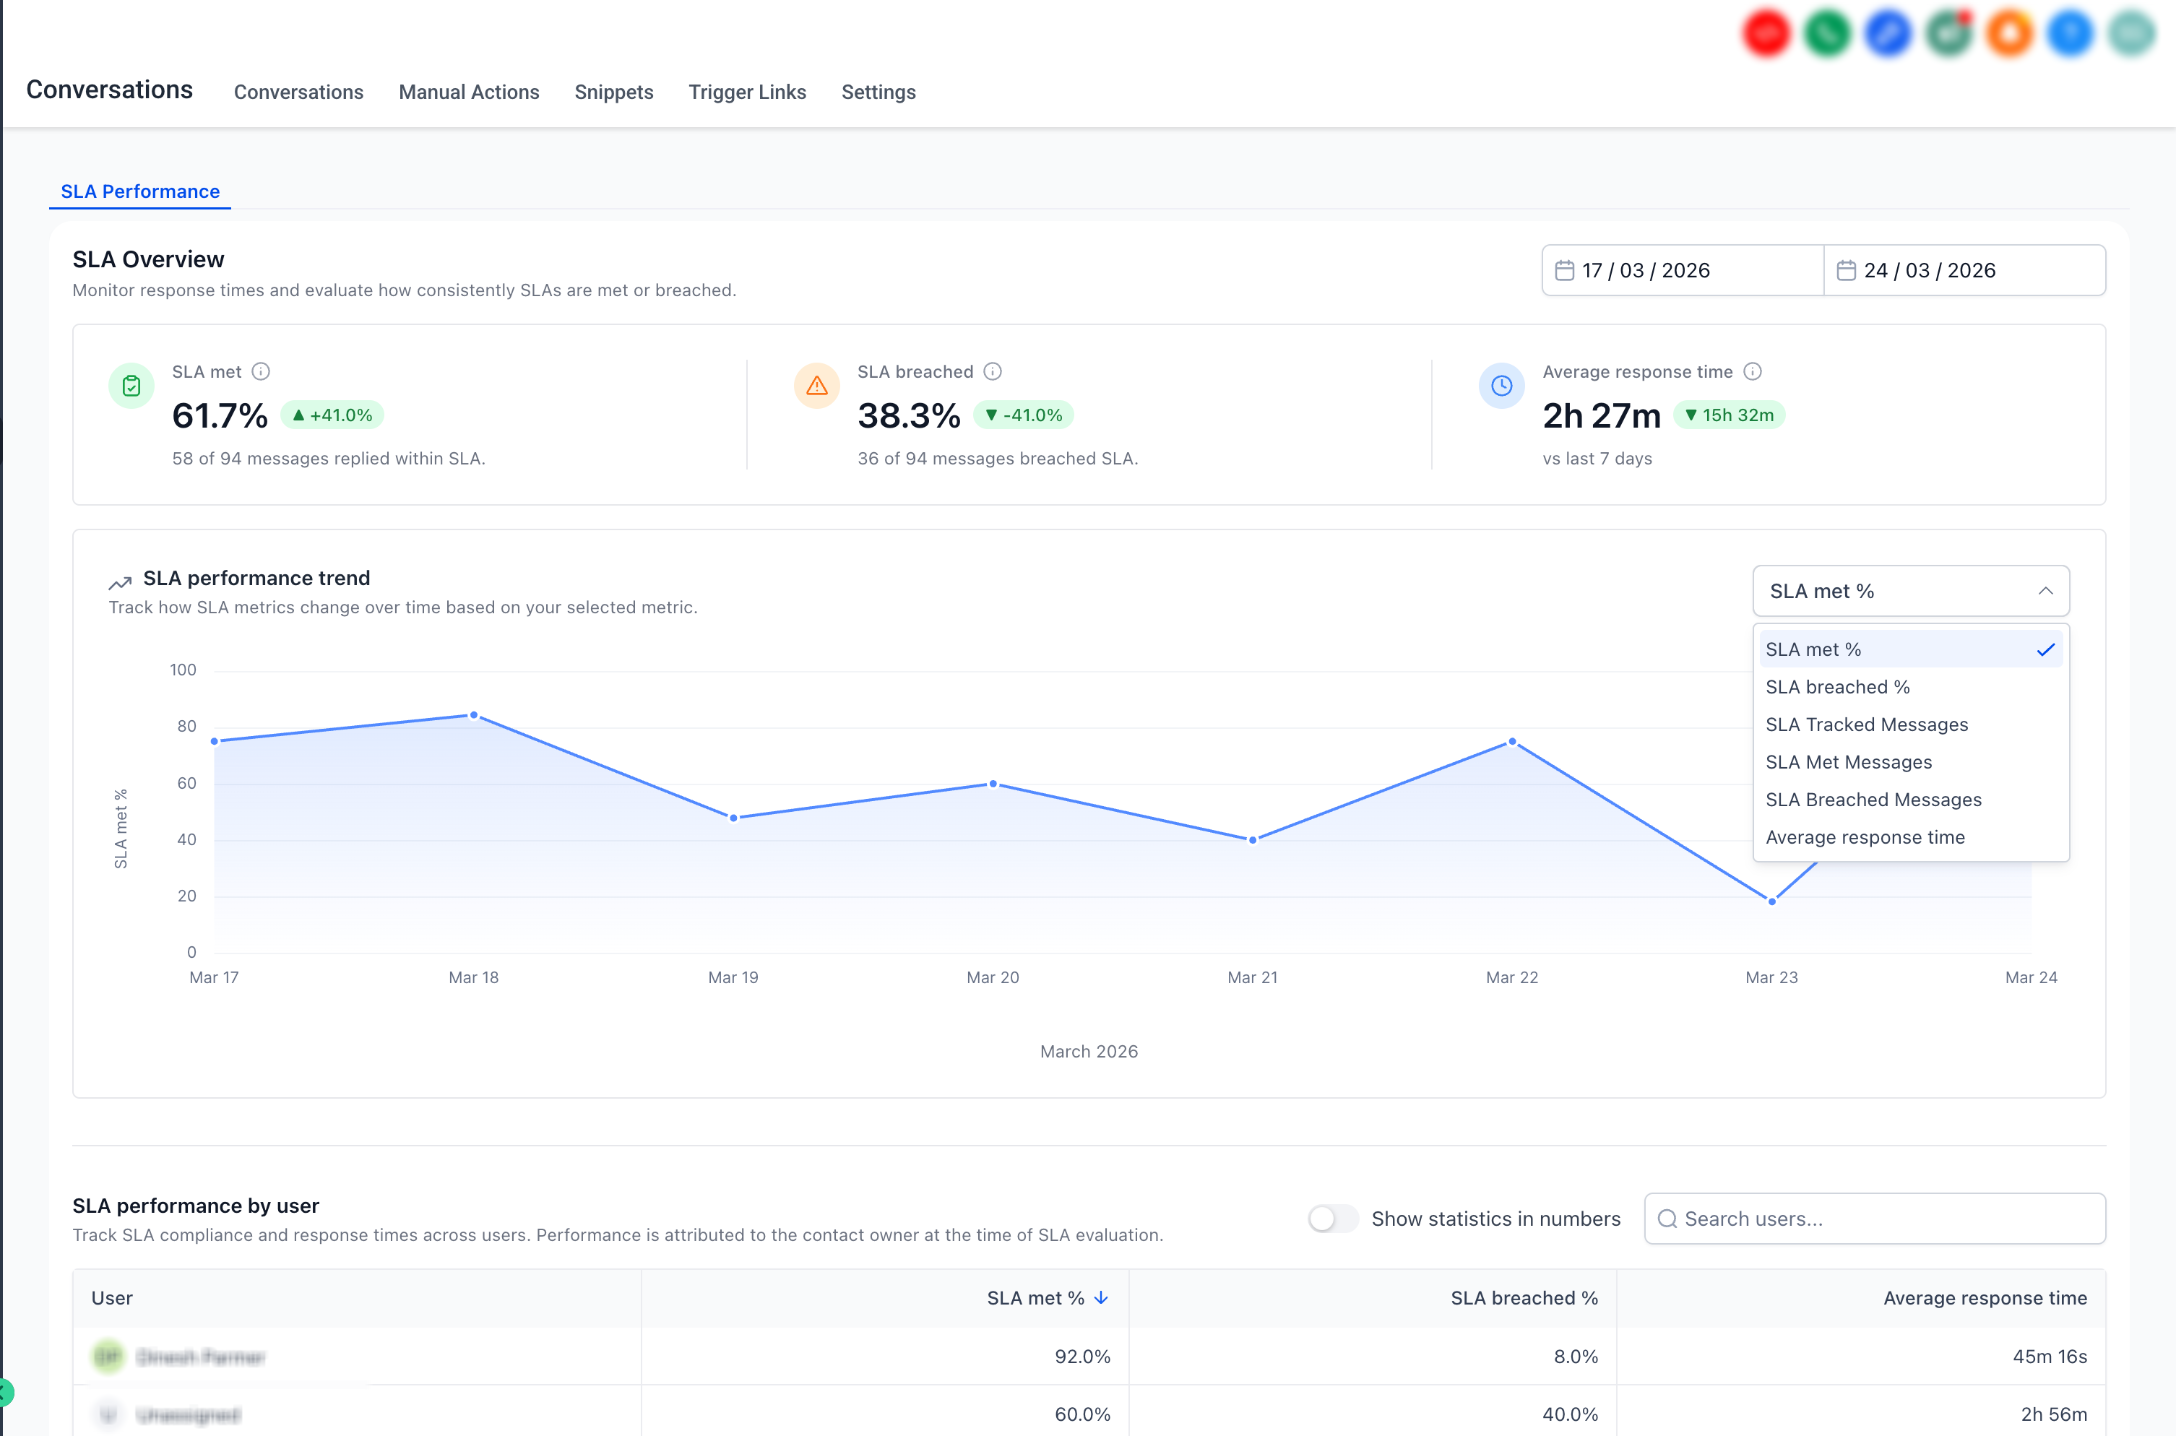
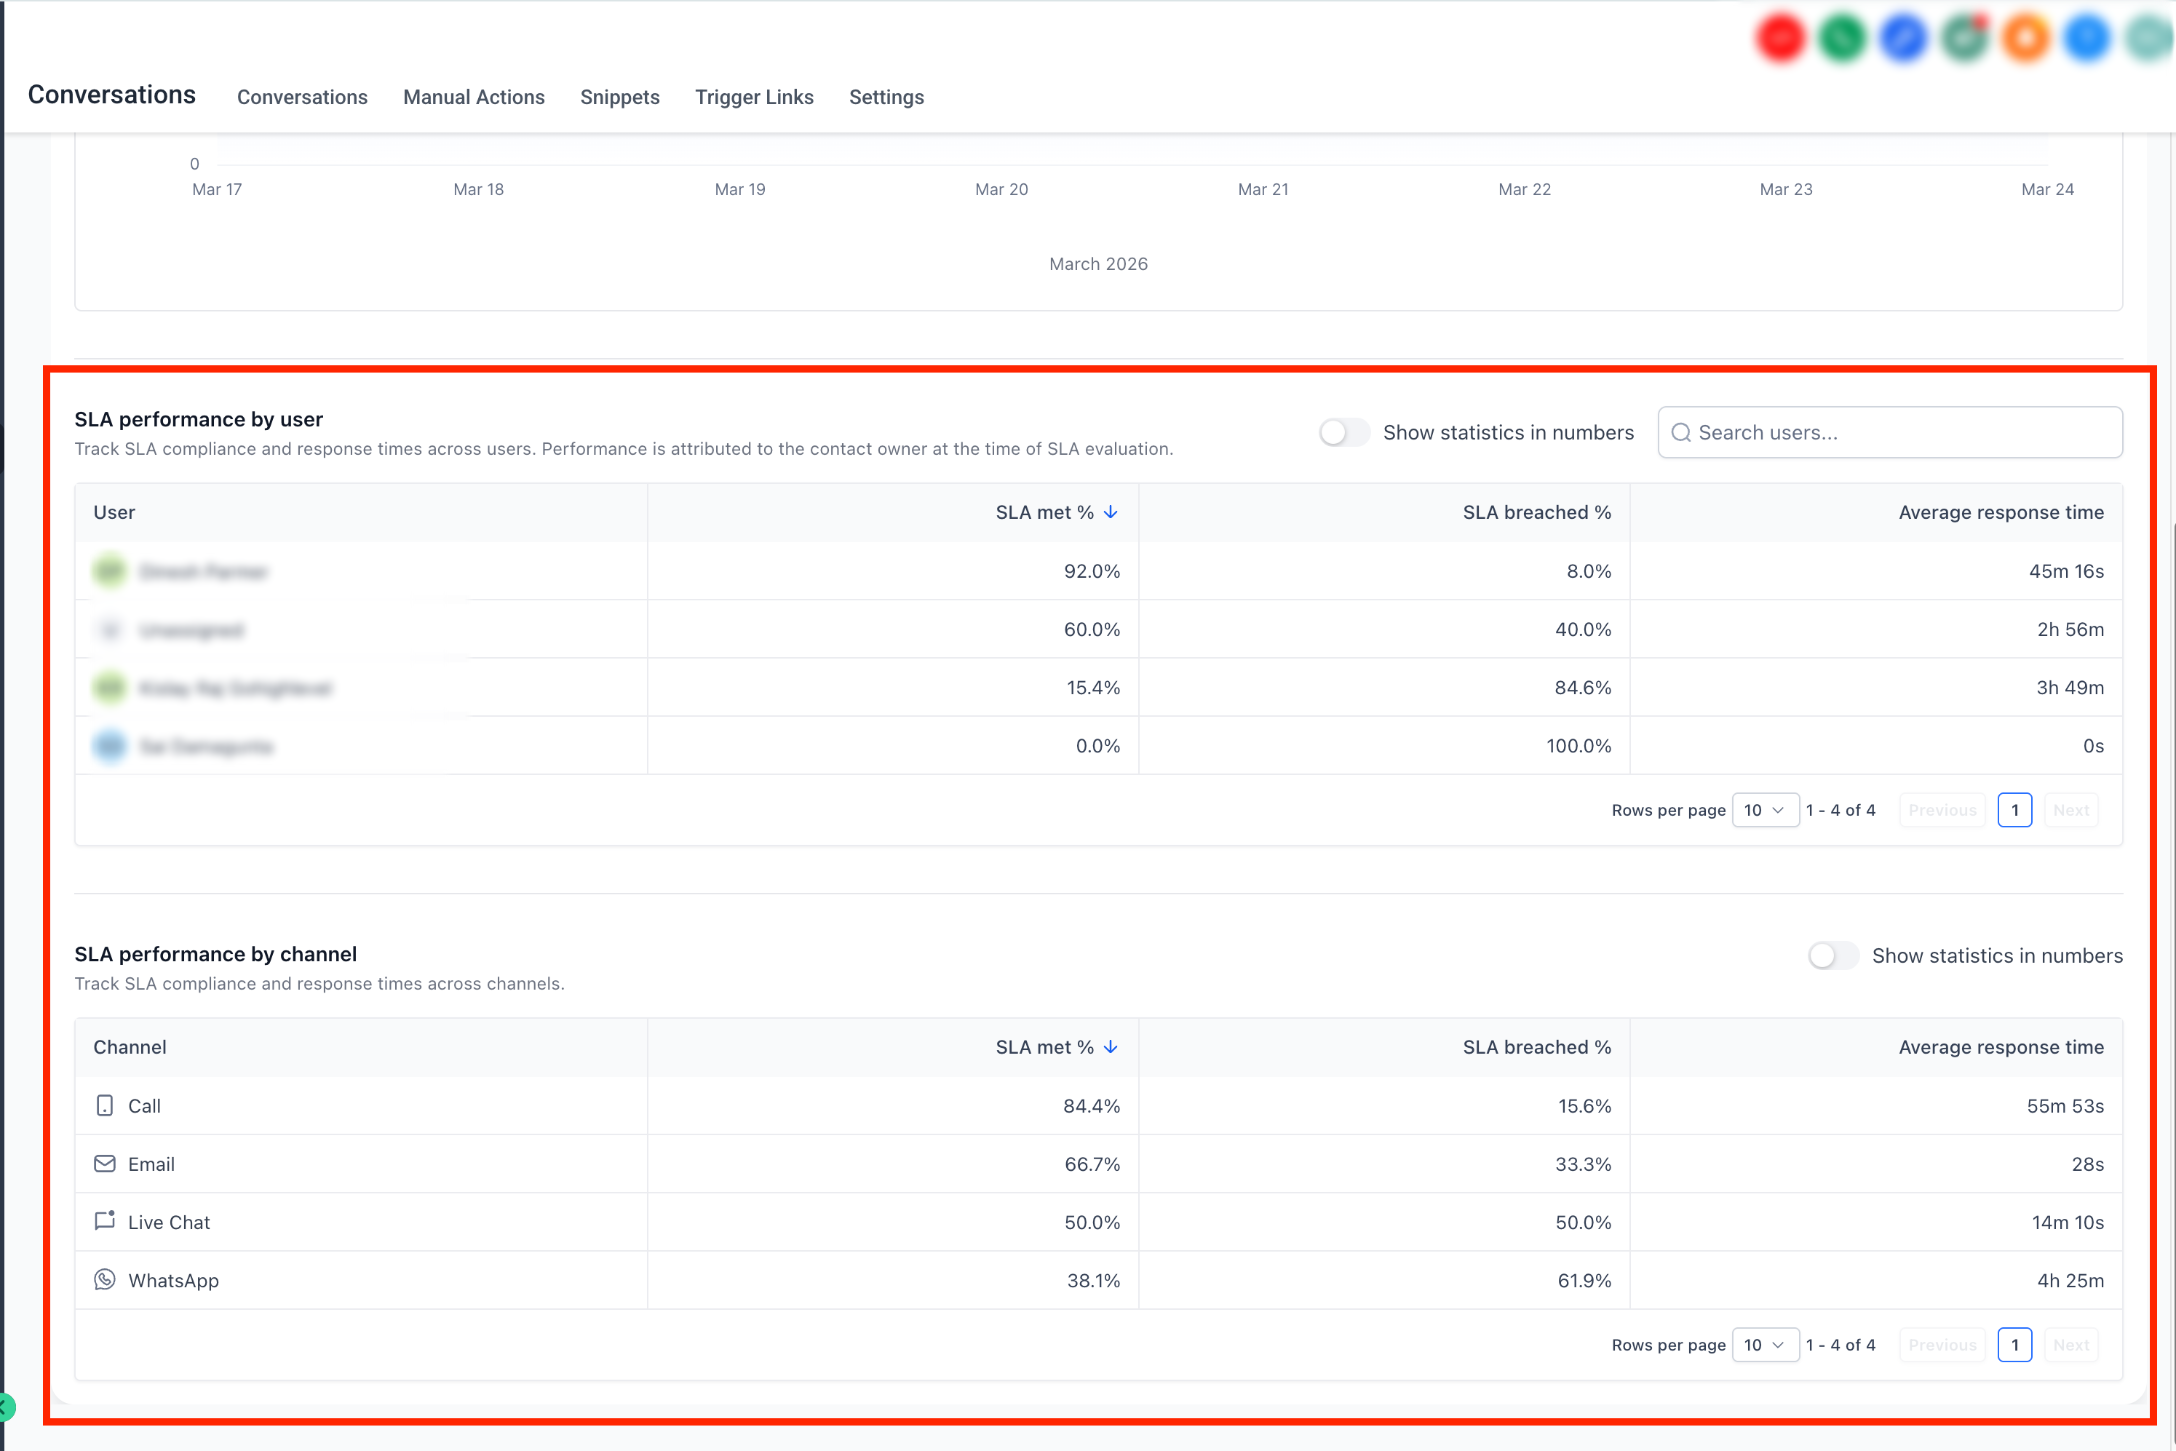
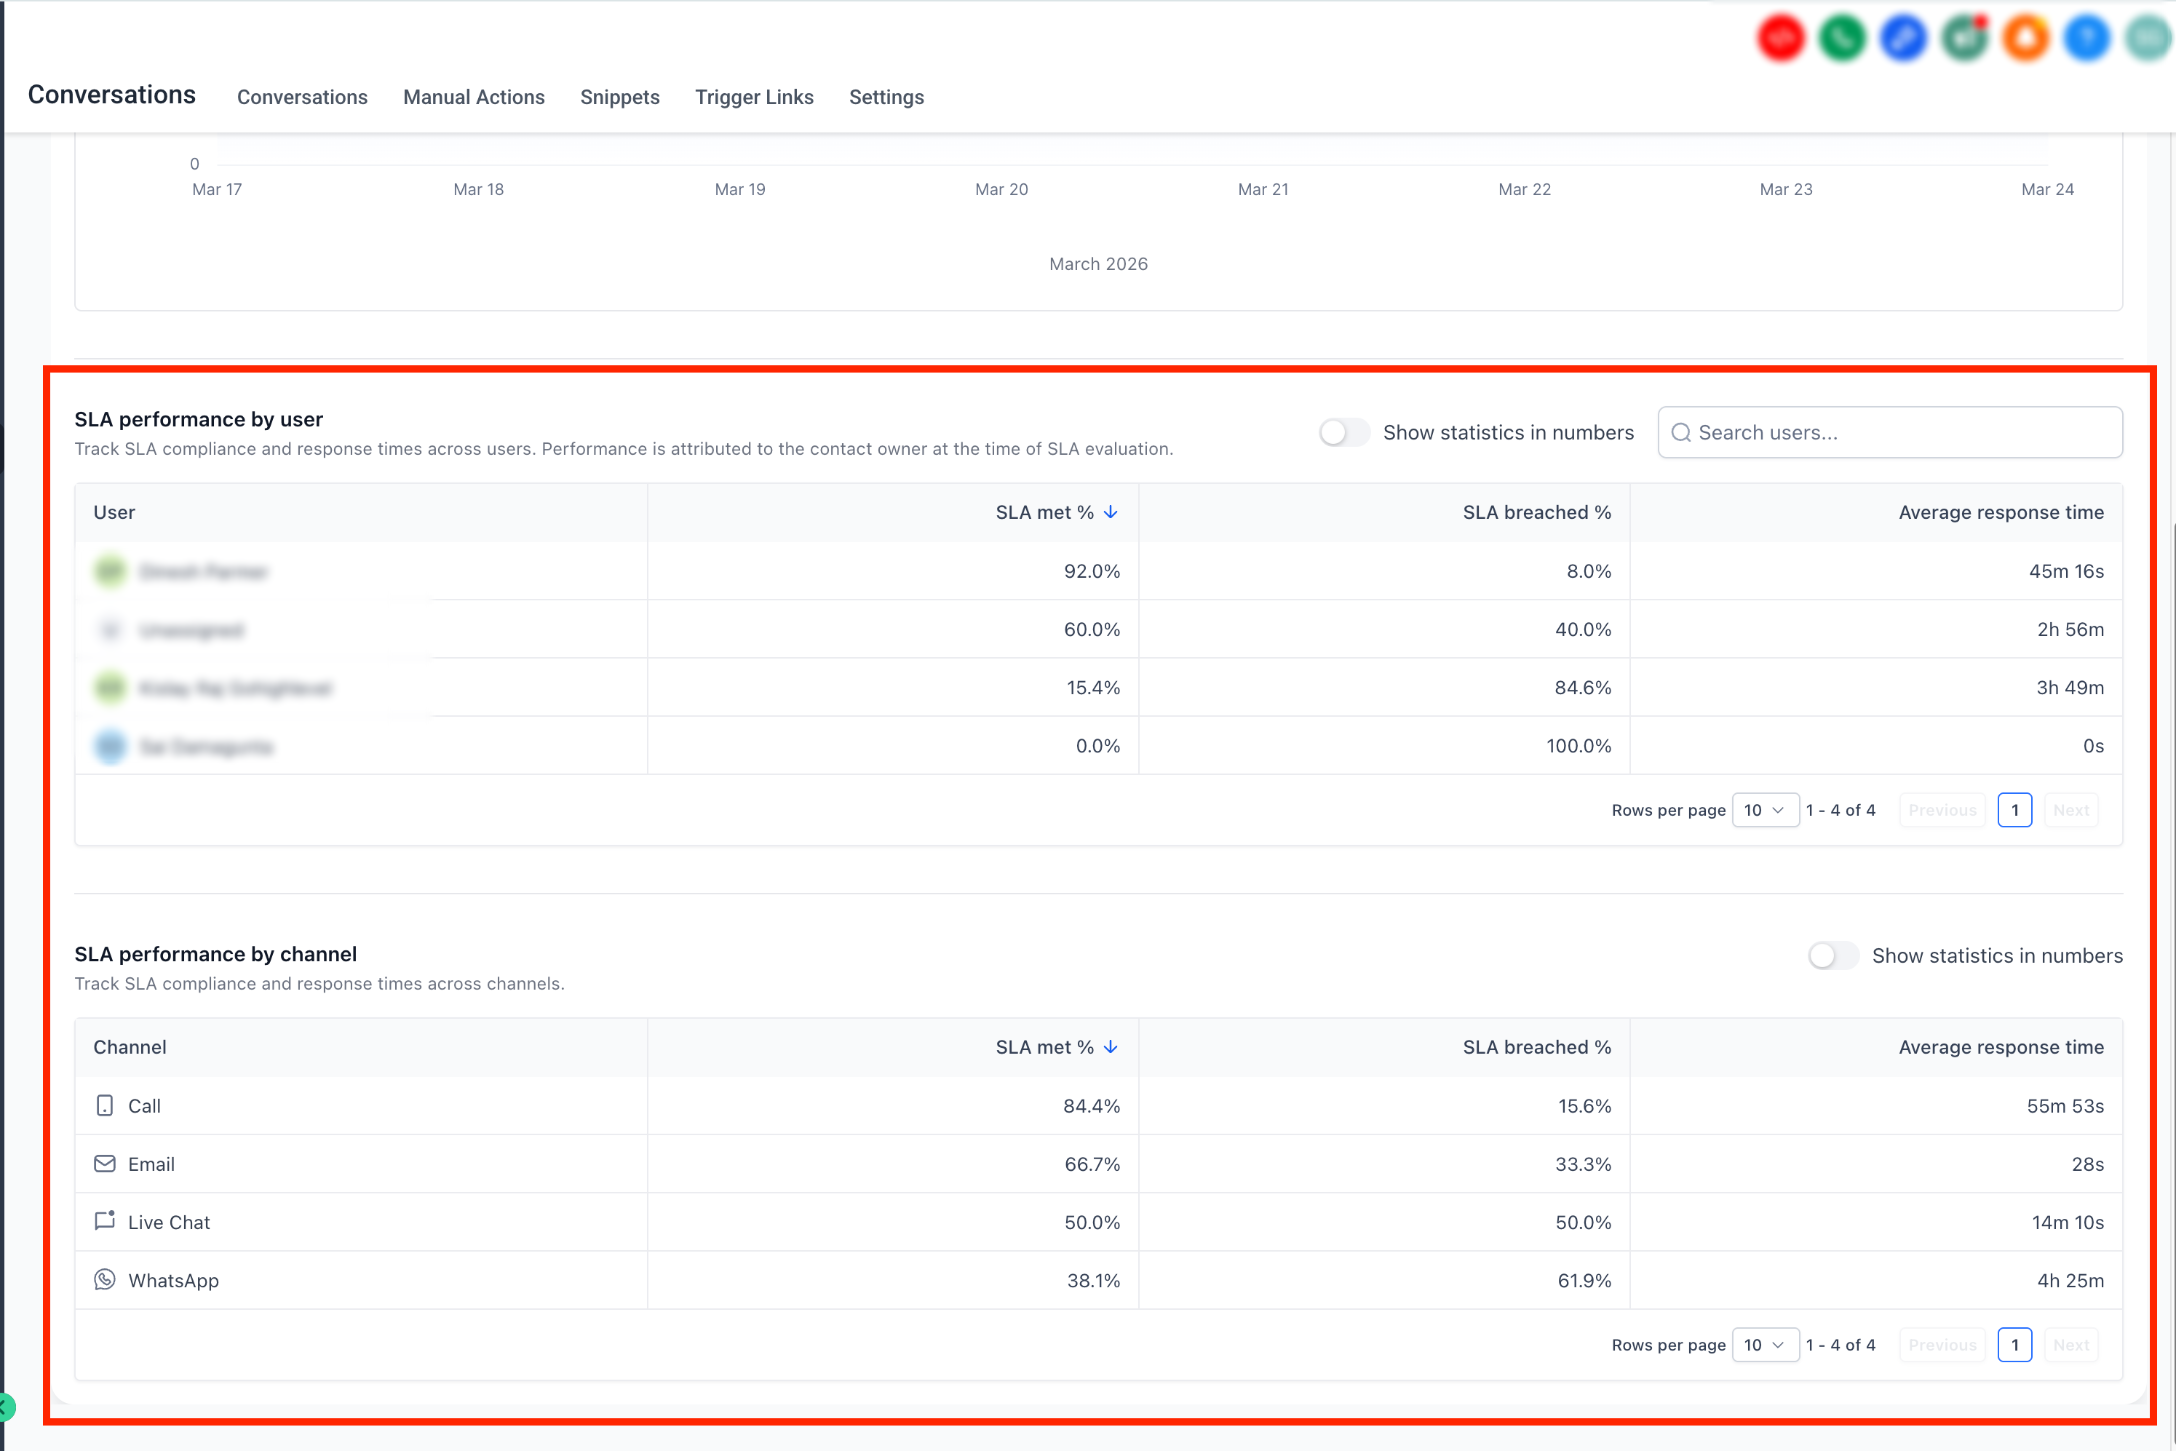
2. User Performance Report
Shows SLA performance for each user.
Attribution Logic:
- SLA performance is attributed to the assigned user at the time of SLA evaluation
- Even if another user replies later, the SLA outcome remains tied to the original owner
3. Channel-Level Report
Breaks down SLA performance by communication channel (e.g., SMS, Email, WhatsApp)
SLA Metrics Explained
- SLA Met % – The percentage of messages that were responded to within the defined SLA time.
For example, if SLA is applied to 100 messages and 60 receive a response before the SLA expires, the SLA Met % is 60%. Messages where the SLA is still active (neither met nor breached) are excluded from this calculation. - SLA Breached % – The percentage of messages that were not responded to within the SLA time.
Only messages where the SLA outcome is determined (met or breached) are included. - Average Response Time:The average time taken to respond to messages where a reply was sent.
Only messages with completed SLA evaluation are included. - SLA Met Messages – The total number of messages that received a response within the SLA time.
- SLA Breached Messages – The total number of messages that did not receive a response before the SLA time expired.
- SLA Tracked Messages: The total number of messages where SLA has been applied and the outcome has been determined. This includes only messages where the SLA is either met or breached. Messages where the SLA is still active are not included.
Filters and Sort
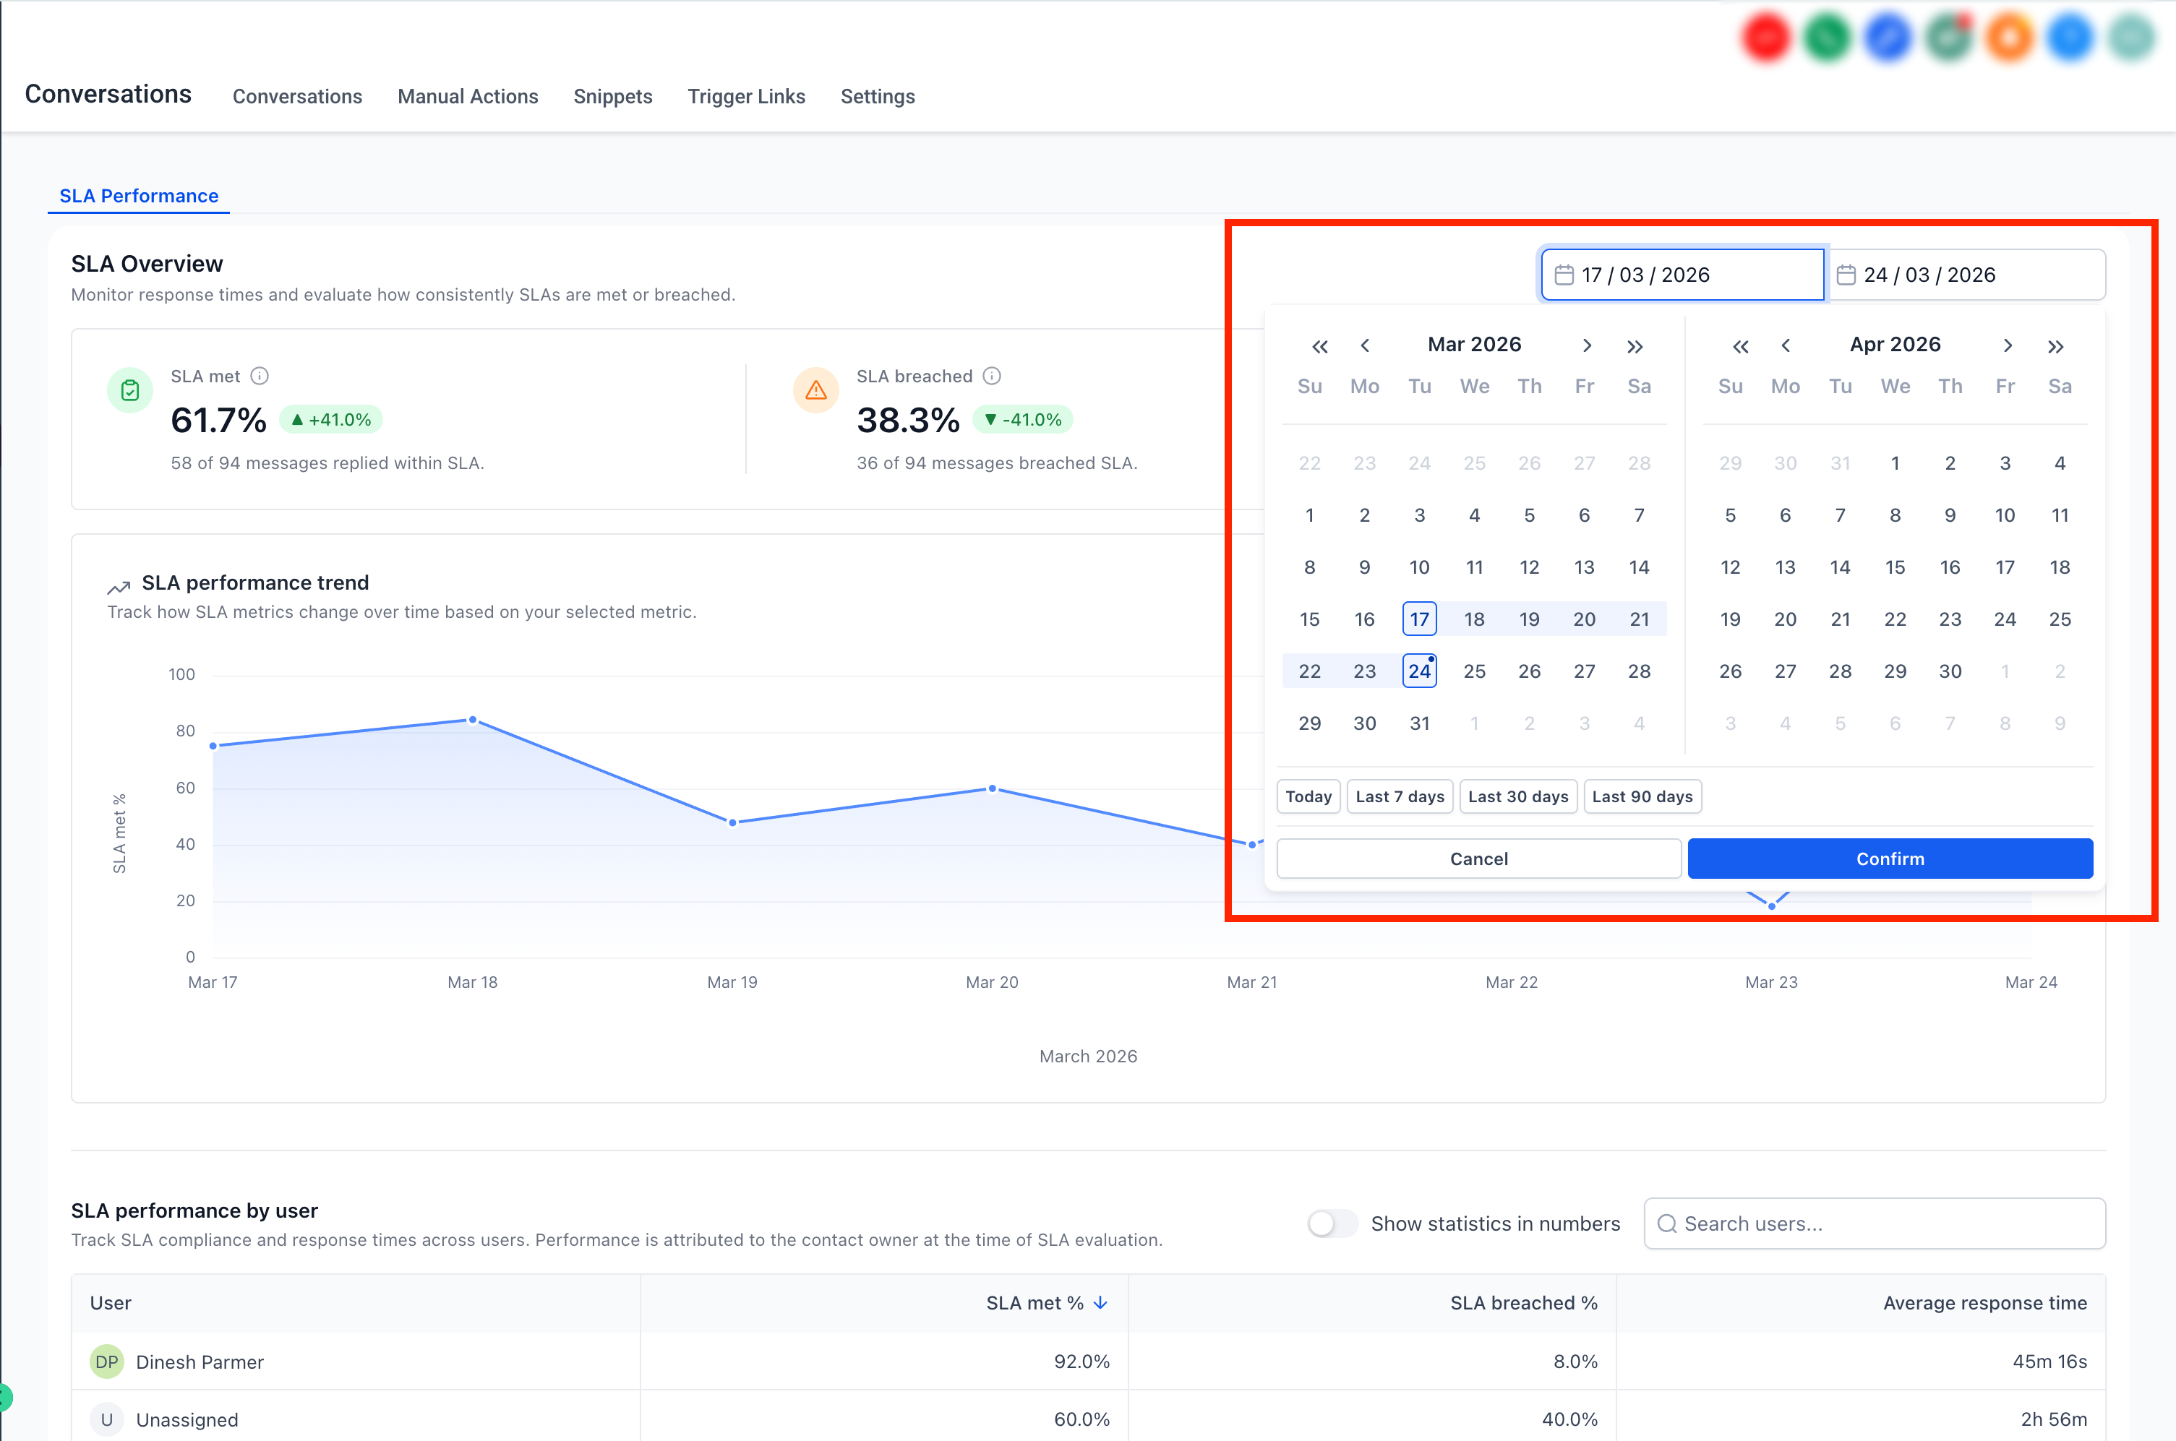
- Use the date filter (Today, Last 7 days, Last 30 days, Custom)
- Use the trend chart dropdown to switch metrics
- Sorting – User performance and Channel performance tables are sorted by SLA Met % (highest to lowest) by default. You can click on column headers to sort by other metrics based on your analysis needs.
- Only messages with completed SLA evaluation (met or breached) are included in reports
- Conversations marked as read without a reply are excluded
- SLA performance is attributed to the assigned user at the time of evaluation
- Only Admins can access SLA Performance reports. Data for SLA Performance Dashboard is available starting May 23, 2026.
Need Help?
If SLA Performance Reporting is missing or showing unexpected results, first review access, interface settings, SLA configuration, and the selected reporting period.
Verify that:
- You are using the supported New Conversations interface.
- Conversations SLA Performance Dashboard is enabled in Labs, if required for your account.
- The required Conversations redesign or updated interface is enabled.
- You have Admin access to view SLA Performance reports.
- You are viewing Conversations → Analytics → SLA Performance.
- The selected date range contains messages with completed SLA evaluations.
- The messages you expect to see had an SLA applied.
- The SLA evaluation has completed as either Met or Breached.
- Messages with an active, unresolved SLA are not expected in completed SLA metrics.
- Conversations marked as read without a reply are not expected to appear in the report.
- User performance is being attributed to the user assigned when the SLA was evaluated.
- The correct channel or user filters are being reviewed.
- Sorting has not changed the order of the results unexpectedly.
- You are not expecting reporting data from before SLA dashboard tracking became available.
If totals appear lower than expected, confirm that the missing conversations completed SLA evaluation during the selected date range. Active SLA timers and read-only conversations without a reply are excluded from completed SLA reporting.
If the issue continues, collect the selected date range, affected user or channel, expected SLA result, actual report values, example conversations, and screenshots of the SLA Performance dashboard before contacting support.